# Shopify Product Data ROI: Measuring Revenue Impact
> A framework for calculating how product data quality affects conversion rate, search visibility, and returns, with worked examples for Shopify stores.
- Published: 2026-10-06
- Author: Importier Team
- Category: Store Management / Compliance & Logistics
- Canonical: https://www.importier.app/blog/shopify-product-data-roi-framework
---
A Perth outdoor gear retailer spent three months improving their product data. They rewrote 800 descriptions with AI, added size guide metafields to 340 clothing SKUs, and uploaded corrected GTINs for all 800 products. They could not tell their board why any of this was worth doing.
The intuition that better product data improves sales is widespread among Shopify merchants. The ability to quantify it is rare. Without a number, data improvement projects compete poorly against paid ads, promotions, and other initiatives where the revenue impact is measured and attributed within days.
This framework produces that number. It is not a precise model; conversion rates vary too much across categories to nail down exact figures. But it is accurate enough to justify a data improvement project, prioritise which improvements to make first, and evaluate whether the work is paying off.
## The Three Revenue Levers of Product Data Quality
Product data quality affects revenue through three distinct pathways. Improving any one of them produces measurable results. Improving all three produces compounding results.
**1. Conversion rate.** A merchant selling a $120 camping backpack needs the description to answer the questions a customer would ask in a physical store: internal dimensions, frame material, rain cover included, hip belt weight rating. A product page that answers those questions converts at a higher rate than one that repeats the product name and a two-sentence manufacturer blurb. Better descriptions directly improve conversion rate.
**2. Search visibility.** [Google's product data specification](https://support.google.com/merchants/answer/7052112) lists GTINs as one of the most important fields for Shopping ad performance. Products without GTINs are less likely to appear in Google Shopping results and cannot participate in automatic item updates. Metafields that map to Shopify's Standard Product Taxonomy feed structured data into the product schema that search engines use to categorise and rank products. Completing these fields increases impression share.
**3. Return rate.** Returns caused by inaccurate or incomplete product data are preventable. A customer who returns a jacket because the size chart in the description did not match the actual fit is a product data failure, not a logistics failure. Accurate size guides, material descriptions, fit notes, and specification data reduce the proportion of returns that originate from mismatched customer expectations.
Each of the three revenue levers operates independently. A merchant can improve conversion rate without touching GTINs, or reduce returns without rewriting descriptions. The framework calculates the impact of each improvement separately so merchants can prioritise by expected return.
## Calculating the Conversion Rate Impact
Start with three numbers: monthly visits to product pages, current add-to-cart rate (or conversion rate), and average order value.
For the Perth outdoor gear retailer:
- Monthly product page visits: 18,400
- Current conversion rate: 2.1%
- Average order value: $112
Monthly revenue from organic product page traffic: 18,400 × 0.021 × $112 = **$43,243**
The question for the conversion calculation: what is the realistic uplift from improving descriptions? Industry benchmarks for e-commerce description improvements range from 0.3 to 0.8 percentage points depending on the product category and how thin the existing descriptions are. For a catalogue where most descriptions are under 100 words (supplier copy), a 0.5 percentage point uplift is a conservative estimate.
Revised revenue at 2.6% conversion: 18,400 × 0.026 × $112 = **$53,529**
Monthly conversion uplift: $53,529 - $43,243 = **$10,286**
For the Perth retailer, this was the number that justified the description improvement project before it started. After three months, their actual conversion rate moved from 2.1% to 2.7%. The conversion uplift exceeded the estimate.

## Calculating the Search Visibility Impact
Search visibility impact is harder to model before the improvement than after, because impression share data is only available retrospectively. The pre-improvement estimate works from product count and GTIN completeness.
For the Perth retailer before the GTIN project:
- 800 products in the catalogue
- 310 products with valid GTINs (39% completeness)
- 490 products without GTINs, ineligible for Shopping auction optimisation
After adding GTINs to all 800 products:
- GTIN completeness: 100%
- Estimated Shopping impression share improvement: the 490 products that were previously ineligible now participate fully in the Shopping auction
The revenue impact of impression share improvement is estimated from the existing Shopping performance: if the 310 products with GTINs generate $X per impression, and the 490 newly-GTIN-enabled products have similar demand, the revenue uplift scales roughly proportionally.
In practice, not every product without a GTIN will have equal Shopping demand. Some products are unique enough that GTINs have limited impact. The conservative calculation assumes that the newly-eligible products generate 40-60% of the per-impression revenue of the existing GTIN-complete products.
For this reason, GTIN completion ranks lower than description quality in the conversion impact calculation; it is essentially free to calculate and implement via an import pass, which changes the cost-benefit ratio considerably.
Description improvements require time and review. GTIN completion requires accurate data from the supplier or a barcode lookup pass. Both improve revenue, but the effort profile is different. The right order is usually: descriptions first, GTINs second.
## Calculating the Return Rate Impact
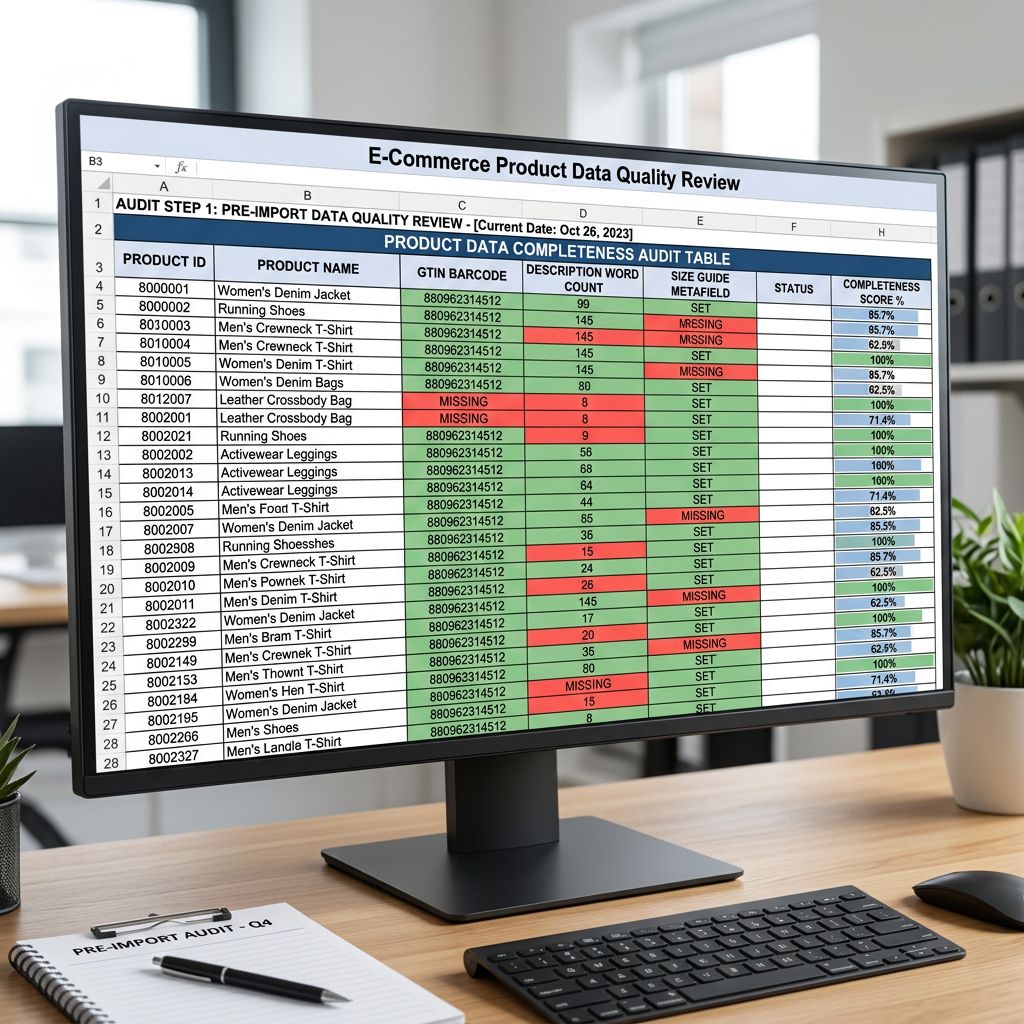
Return rate impact is the most directly measurable of the three levers because Shopify provides return reason data. Filter your returns by reason. Isolate returns tagged "incorrect size", "not as described", "wrong colour/material", or any reason that maps to a data accuracy problem. These are your preventable returns.
For the Perth retailer, clothing returns broke down as:
- 340 clothing SKUs, 1,200 clothing orders per month at $94 average order value
- Return rate on clothing: 12.1% (145 returns/month)
- Return reasons: "sizing different to description" (58%), "material not as expected" (22%), "product different from photo" (11%), other (9%)
- Data-related returns: 91% × 145 = **132 returns/month**
- Average refund amount: $94 (full refund)
- Monthly revenue lost to data-related returns: **$12,408**
After adding size guide metafields and improving material descriptions on all 340 clothing SKUs, the return rate dropped to 7.4% (89 returns/month). The return rate reduction from data improvements alone: 56 fewer returns/month × $94 = **$5,264/month in recovered revenue**.
This calculation is the most compelling for management review because it is directly observable in return data, requires no assumptions about conversion rate modelling, and produces an exact figure.

## Running the Framework for Your Catalogue
The calculation has five steps. Steps 1-3 collect the inputs. Steps 4-5 apply the estimates.
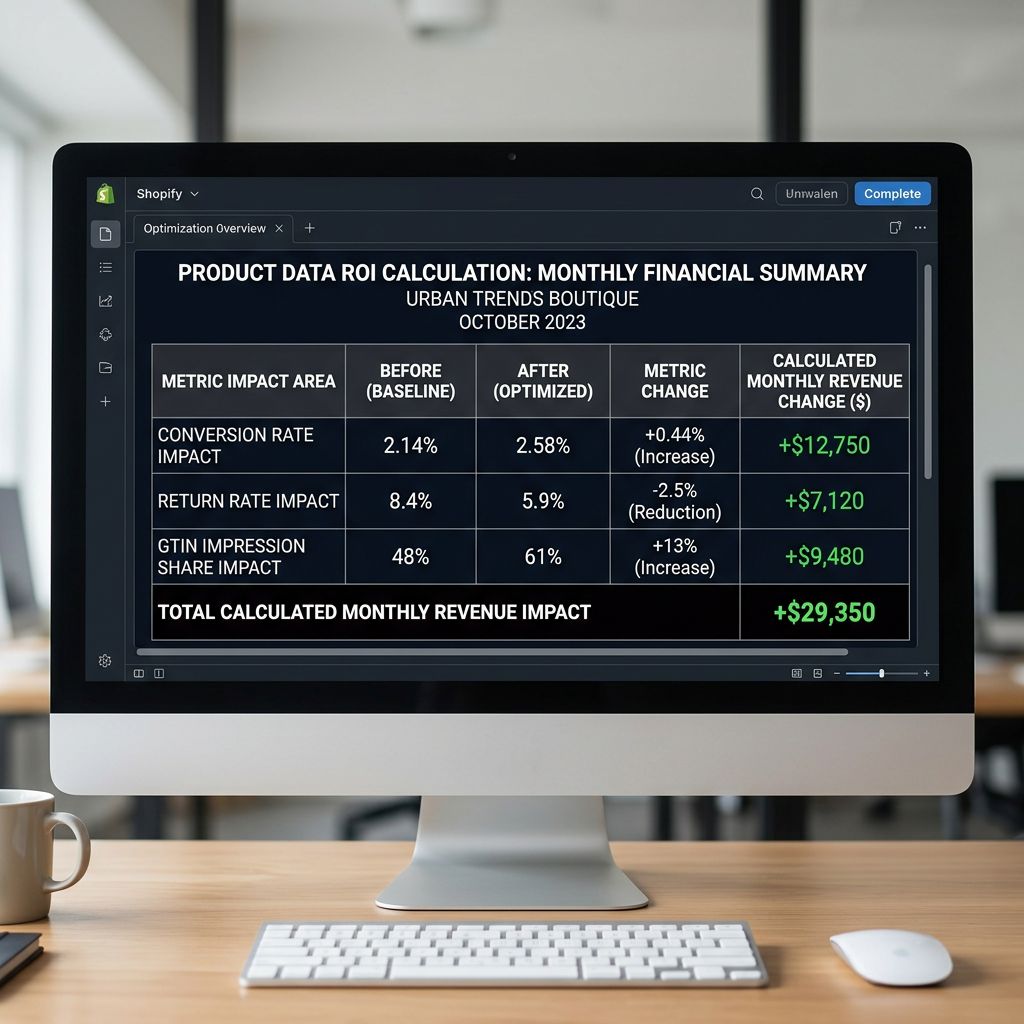
The total estimated monthly revenue impact is the sum of the conversion impact plus the return impact. Add the impression share improvement as an additional estimate if GTIN completion is part of the project scope.
## Prioritising Which Data to Improve First
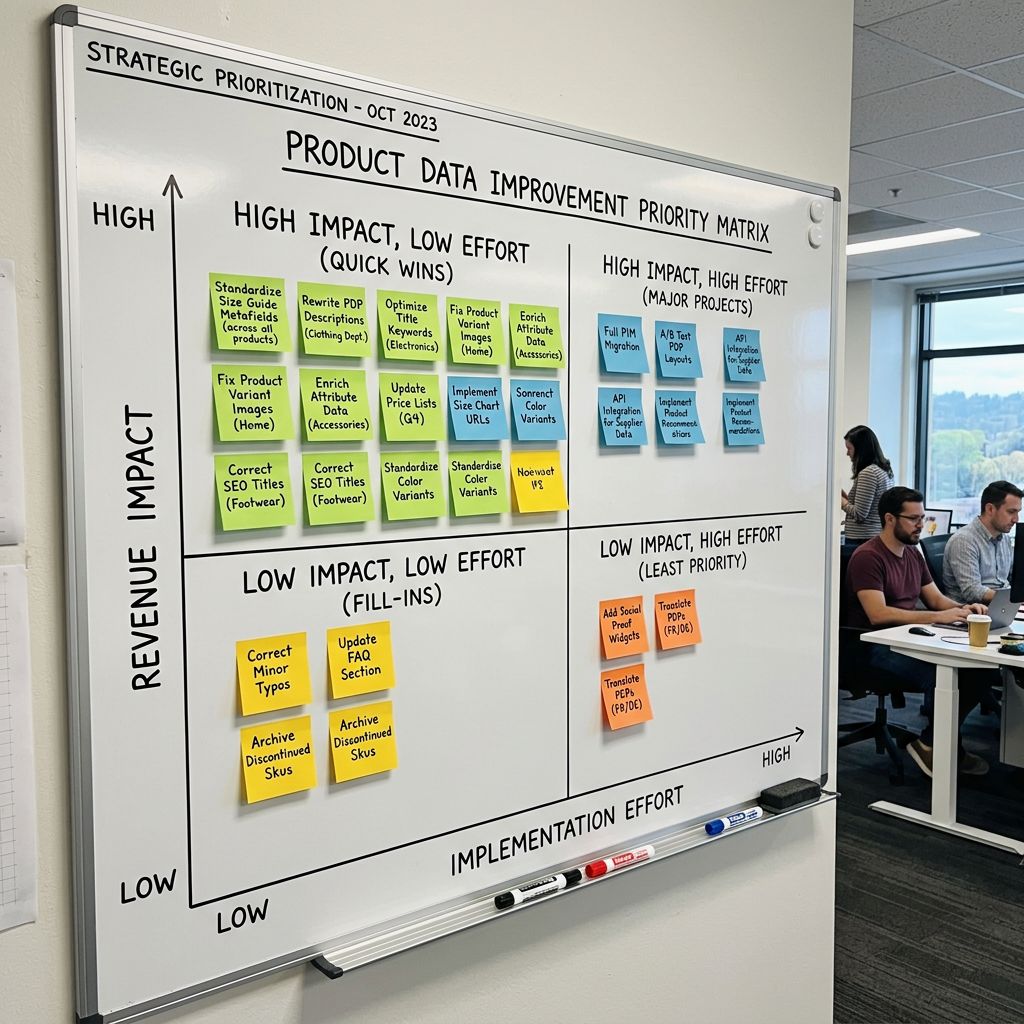
Not every product needs every improvement. The framework produces an expected revenue impact per product, which lets you prioritise:
**Highest impact: high-traffic products with thin descriptions.** Products that receive significant search traffic but have low-quality descriptions. The impression share is already there; the conversion is being lost. Improving descriptions on these products has the highest return per hour of effort.
**Second priority: clothing and sized products with missing size guide data.** If return rate analysis shows sizing-related returns are significant, size guide metafields have a clear and direct revenue impact. For a 10% return rate on clothing with 60% of returns citing sizing, the calculation is simple.
**Third priority: GTIN completion on distributed products.** Products sold by multiple retailers where the GTIN enables Google Shopping participation. For unique or custom products that cannot be found elsewhere, GTIN completion has limited Shopping impact.
The [product data customer retention article](https://importier.app/blog/shopify-product-data-customer-retention) covers how product data quality affects repeat purchase rate and customer lifetime value, the longer-term revenue dimension that is harder to calculate in a 90-day window but compounds significantly over a year.
The [product import ROI article](https://importier.app/blog/shopify-product-import-roi) covers the operational efficiency dimension of import automation: how much time and labour cost Importier saves versus a manual import process. That calculation answers "is Importier worth paying for?" This framework answers the adjacent question: "which product data improvements are worth the time to make, and in what order?"
Both calculations are worth having. Together they account for the full return on a data quality investment: time saved on import, plus revenue generated by the better data that results.
Try Importier free at importier.app.